- البداية
- التفقه في الدين
- تطوير الويب Web Development
- مهارات ايمانية
- المهارات الناعمة Soft Skills
- الذكاء الاجتماعي Social Intelligence
- مهارة ادارة الضغوط النفسية management stress Skill
- التغلُّب على الإدمان Overcoming addiction
- ميديا Media
- كورسات اللغات Languages Courses
- كورسات ادارة الأعمال Business Administration
- مهارات Skills
- كورسات هندسة Engineering Courses
- تطوير الموبايل Mobile Development
- الجرافيك Graphic
- الشبكات Networks
- المحاسبة Accountancy
- الدعم الفنى Technical Support
- البرمجة Programming
- التسويق Marketing
- الطب Medicine
- الرياضة Sport
- فيزياء ورياضيات Mathematics and Physics
- علوم اقتصادية Economic sciences
- المناهج التعليمية Educational Curriculum
- التنمية البشريه العام Public human development
- تصميم المواقع Web Design
- IOS IOS
- Node.js Node
- Ember.Js Ember
- Angular.JS Angular
- MongoDB Mongodb
- Fedora Tutorials Fedora
- CentOs Tutorials Centos
- XML XML
- قواعد البيانات العام Database
- مهارات الحاسب computer skills
- Arduino Arduino
- Linux Tutorials Linux
- التصوير العام General Photography
- إدارة المحتوي CMS CMS
- المزيد
Lesson 9 - Building Line Charts in SPSS
Lesson 9 - Building Line Charts in SPSS
237
أضيف في:
22 مارس 2019
22 مارس 2019
مقطع فيديو من كورس SPSS For Research في كورسات
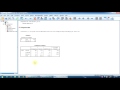
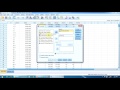
The line charts are generally used to represent the time series, but they can be also an alternative to bar charts when we want to visualise the differences between the levels of a categorical variable.
رنامج (spss) هو اختصار (Statistical package for social sciences) وهو ما يعني الحزم الإحصائية للعلوم الاجتماعية , وبرنامج spss هو عبارة عن مجموعة من الحزم أو بيانات حسابية شاملة للقيام بتحليل هذه البيانات , ويتم استخدام هذا البرنامج في الأبحاث العلمية التي تحتوي على بيانات رقمية . يستطيع البرنامج القيام بقراءة كافة البيانات من كافة أنواع الملفات وتحليلها واستخراج النتائج والتقرير الإحصائية , والبرنامج يتيح للمستخدم تحرير البيانات وتعديلها في شكل متغيرات وبيانات جديدة باستخدام معادلة , وكذلك حفظ البيانات في ملفات وتسميتها أو تعديل أسماء ملفات البيانات , أو استرجاع البيانات والملفات والمشاهدات , وذلك من خلال التحكم في قائمة من الأوامر والخيارات المتاحة في البرنامج , لتشمل كافة مراحل تحليل البيانات والعملية ال إحصائية من خلال اربع خطوات هي : 1– ترميز البيانات . 2- وضع البيانات في البرنامج . 3- انتقاء الشكل المناسب واختبار البيانات وتحليلها . 4- تحديد البيانات المتغيرة المراد تحليلها وتحقيق عملية الإحصاء .
المزيد..
The line charts are generally used to represent the time series, but they can be also an alternative to bar charts when we want to visualise the differences between the levels of a categorical variable.
رنامج (spss) هو اختصار (Statistical package for social sciences) وهو ما يعني الحزم الإحصائية للعلوم الاجتماعية , وبرنامج spss هو عبارة عن مجموعة من الحزم أو بيانات حسابية شاملة للقيام بتحليل هذه البيانات , ويتم استخدام هذا البرنامج في الأبحاث العلمية التي تحتوي على بيانات رقمية . يستطيع البرنامج القيام بقراءة كافة البيانات من كافة أنواع الملفات وتحليلها واستخراج النتائج والتقرير الإحصائية , والبرنامج يتيح للمستخدم تحرير البيانات وتعديلها في شكل متغيرات وبيانات جديدة باستخدام معادلة , وكذلك حفظ البيانات في ملفات وتسميتها أو تعديل أسماء ملفات البيانات , أو استرجاع البيانات والملفات والمشاهدات , وذلك من خلال التحكم في قائمة من الأوامر والخيارات المتاحة في البرنامج , لتشمل كافة مراحل تحليل البيانات والعملية ال إحصائية من خلال اربع خطوات هي : 1– ترميز البيانات . 2- وضع البيانات في البرنامج . 3- انتقاء الشكل المناسب واختبار البيانات وتحليلها . 4- تحديد البيانات المتغيرة المراد تحليلها وتحقيق عملية الإحصاء .


-
الفيديو التالي:
-
 255
11 Lesson 10 - Building Scatterplot Charts in SPSS
255
11 Lesson 10 - Building Scatterplot Charts in SPSS
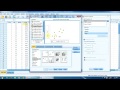
The scatterplot charts are ideal for representing the relationship between two continuous variables. We need this before running procedures like correlation and regression, because these analyses require a linear relationship between the variables, and the scatterplot helps as verify this condition.

-
 311
1- SPSS for Research - Course Outline (for the entire course)
311
1- SPSS for Research - Course Outline (for the entire course)
كورس SPSS For Research Over the next few days, you will master all the essential skills of an SPSS data analyst, from the simplest operations with data to the advanced multivariate techniques like logistic regression, multidimensional scaling or principal component analysis. The good news – you don’t need any previous experience with SPSS. If you know the very basic statistical concepts, that will do. And you don’t need to be a mathematician or a statistician to take this course (neither am I). This course was especially conceived for people who are not professional mathematicians – all the statistical procedures are presented in a simple, straightforward manner, avoiding the technical jargon and the mathematical formulas as much as possible. The formulas are used only when it is absolutely necessary, and they are thoroughly explained. Are you a student or a PhD candidate? An academic researcher looking to improve your statistical analysis skills? Are you dreaming to get a job in the statistical analysis field some day? Are you simply passionate about quantitative analysis? This course is for you, no doubt about it. Please note, this is not just an SPSS tutorial. It does not only show you which menu to select or which button to click in order to run some procedure. This is a hands-on statistical analysis course in the proper sense of the word. --- -
 329
2- Lesson 1 - Working With SPSS Files
329
2- Lesson 1 - Working With SPSS Files
كورس SPSS For Research 56 essential analyses techniques from basic to advanced - the most comprehensive SPSS video course – give it a try today! Before running any statistical procedure in SPSS, we must know how to create a new file and how to open an existing file. For an experienced Windows user, these tasks are not difficult. -
 232
3- Lesson 2 - Defining Variables
232
3- Lesson 2 - Defining Variables
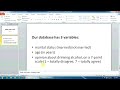
كورس SPSS For Research In this lesson we are going to learn how to define the variables in an SPSS database. To keep it simple, let’s suppose that our database will only have three variables: respondent’s marital status, respondent’s age and respondent’s opinion about drinking alcohol, on a scale from 1 to 7, where 1 is totally disagree and 7 is totally agree. -
 282
4- Lesson 3 - Recoding Variables in SPSS
282
4- Lesson 3 - Recoding Variables in SPSS
كورس SPSS For Research When is it necessary to recode our variables? Generally, when the values of a categorical variable are not defined in a convenient way for the analyst. -
 287
5- Lesson 4 - Dummy Variables
287
5- Lesson 4 - Dummy Variables
كورس SPSS For Research One of the most important skills a statistical analyst should get is creating and using dummy variables. Dummy variables are categorical variables that take only two values: zero and one. They are used especially in regression models as predictors. In the first part of this video we will explain how to convert a dichotomous variable in a dummy one; the second part will show how to convert a multinomial (or polytomous) variable in a dummy variable. -
 267
6- Lesson 5 - Selecting Cases in SPSS
267
6- Lesson 5 - Selecting Cases in SPSS
كورس SPSS For Research Become an expert in statistical analysis with SPSS within days - essential analyses techniques from basic to advanced - the most comprehensive SPSS video course – -
 345
7- Lesson 6 - File Splitting in SPSS
345
7- Lesson 6 - File Splitting in SPSS
كورس SPSS For Research The split file procedure is useful when we want to run the same analysis on several groups or segments of the entire population. When a file is split, the analyses will be run for each group separately, and the output will be presented separately too. -
 265
8- Lesson 7 - Weighing Data in SPSS
265
8- Lesson 7 - Weighing Data in SPSS
كورس SPSS For Research In most SPSS databases, each row corresponds to a single case. For example, if the survey sample had one hundred respondents, the database will have one hundred rows. However, in some situations the raw data we collected do not present the values for each case, but only the frequencies of these values. In such circumstances, we cannot create an usual database, where each row represents one case. We must find a workaround. -
 243
9- Lesson 8 - Building Column Charts in SPSS
243
9- Lesson 8 - Building Column Charts in SPSS
كورس SPSS For Research https://goo.gl/vhRulc In this section we are going to learn how to build four important chart types in the SPSS program: the bar chart, the line chart, the scatter chart and the boxplot diagram. As for another useful type of chart, the histogram, we’ll approach it in the lesson about normality tests. The SPSS chart builder is vey advanced, providing a wide array of editing options. I don’t intend to go through all of them in detail, because this is not our goal here. If you are particularly interested in building charts with SPSS, you will be able to discover all the options easily. The topic of this video lesson is how to build a bar chart (or a column bar chart, as it is called often). This chart is useful when our independent variable has discrete values, I mean, it is categorical, either nominal or ordinal. -
 237
10- Lesson 9 - Building Line Charts in SPSS
237
10- Lesson 9 - Building Line Charts in SPSS
كورس SPSS For Research The line charts are generally used to represent the time series, but they can be also an alternative to bar charts when we want to visualise the differences between the levels of a categorical variable. -
255
11- Lesson 10 - Building Scatterplot Charts in SPSS
كورس SPSS For Research The scatterplot charts are ideal for representing the relationship between two continuous variables. We need this before running procedures like correlation and regression, because these analyses require a linear relationship between the variables, and the scatterplot helps as verify this condition. -
 332
12- Lesson 11 - Building Boxplot Charts in SPSS
332
12- Lesson 11 - Building Boxplot Charts in SPSS
كورس SPSS For Research As you know, the boxplot diagram is a very useful tool for studying the distribution of a continuous variable, and especially for detecting the outliers of the distribution, if there are any. It’s also called box-and-whisker diagram. -
 238
13- Lesson 12 - Building Frequency Tables in SPSS
238
13- Lesson 12 - Building Frequency Tables in SPSS
كورس SPSS For Research The frequencies procedure is primarily used for discrete data (nominal or ordinal variables), but some of its options are useful for scale variables too. This procedure generates the frequency table for the variable of interest, as well as a good number of important statistics (if our variable is continuous, of course). -
 272
14- Lesson 13 - Generating Descriptive Statistics in SPSS (for continuous variables)
272
14- Lesson 13 - Generating Descriptive Statistics in SPSS (for continuous variables)
كورس SPSS For Research The Descriptives procedure is useful for analyzing continuous variables. Just like the Frequency procedure, it computes the main statistical metrics for our variable of interest. Unlike the Frequency procedure, it does not generate the frequency table. -
 252
15- Lesson 14 - The Explore Procedure in SPSS (getting more out of the data)
252
15- Lesson 14 - The Explore Procedure in SPSS (getting more out of the data)
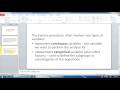
كورس SPSS For Research Basically, the Explore procedure does exactly what the previous two procedures do: computing and generating a list of statistical indicators for our variable. However, it has an important extra facility: it allows us to do the analyze not only for the entire population, but also for subgroups or strata of this population. So the Explore procedure often involves two types of variables: * Dependent continous variables – these are the variables we want to perform the analysis for * Independent categorical variables (also called factors) – these are used to define the subgroups or subcategories of the population. -
 260
16- Lesson 15 - The Means Procedure in SPSS
260
16- Lesson 15 - The Means Procedure in SPSS
كورس SPSS For Research The means procedure is used to analyze the continuous variables. Just like the Explore procedure, the Means procedure works with continuous dependent variables and categorical independent variable. However, unlike Explore, the Means procedure allows us to enter the independent variable by layers, so it can generate some report that the Explore procedure can not. -
 273
17- Lesson 16 - Building Cross Tables in SPSS
273
17- Lesson 16 - Building Cross Tables in SPSS
كورس SPSS For Research This procedure is used to create cross tables or contingency tables. These tables are very useful for visually examining the relationship between two categorical variables. Basically, a crosstab contains the number of cases (the frequencies) for all the possible combinations of the two variables. -
 212
18- Lesson 17 - Pearson Correlation in SPSS (introduction)
212
18- Lesson 17 - Pearson Correlation in SPSS (introduction)
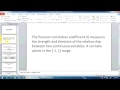
كورس SPSS For Research The Pearson correlation coefficient measures the strength and direction of the relationship between two continuous variables. It can take values in the minus one, one range. Minus one means a perfect negative correlation, while one means a perfect positive correlation. The Pearson coefficient is noted with r. Most often, the researcher wants to assess the correlation in the total population. To that effect, he or she must determine whether this coefficient is different from zero in the population. -
 242
19- Lesson 18 - Pearson Correlation in SPSS (assumption testing)
242
19- Lesson 18 - Pearson Correlation in SPSS (assumption testing)
كورس SPSS For Research The Pearson correlation coefficient measures the strength and direction of the relationship between two continuous variables. It can take values in the minus one, one range. Minus one means a perfect negative correlation, while one means a perfect positive correlation. The Pearson coefficient is noted with r. Most often, the researcher wants to assess the correlation in the total population. To that effect, he or she must determine whether this coefficient is different from zero in the population. -
 232
20- Lesson 19 - Pearson Correlation in SPSS (intepreting the results)
232
20- Lesson 19 - Pearson Correlation in SPSS (intepreting the results)
كورس SPSS For Research The Pearson correlation coefficient measures the strength and direction of the relationship between two continuous variables. It can take values in the minus one, one range. Minus one means a perfect negative correlation, while one means a perfect positive correlation. The Pearson coefficient is noted with r. Most often, the researcher wants to assess the correlation in the total population. To that effect, he or she must determine whether this coefficient is different from zero in the population.


 تصميم قالب مدونة HTML5/CSS3
 كورس Maya
 Android kernel (Security)
 الإخراج السينمائي - السيناريو
 دورة الجافا – الواجهات الرسومية
 Mansoura Radiology Diploma (I) 2017
 برنامج اعداد المدربين
 Visual Basic 2012+ MS Access ربط فيجوال بيسك 2012 وأكسس
 ما لا تعرفه عن استخدام التكنولوجيا في التعليم
 بناء الشخصية الإسلامية
 Introduction to Financial Accounting - كورس محاسبة بالانجليزى كامل
 دورة Php-Mysql
 ادارة الذات
 ابواب النفس
 فن الحديث و التواصل مع الآخرين
 التخاطر وتوارد الأفكار والتخيّل
 الانضباط الذاتي وعلاج التسويف
 تلخيص الكتب
 مقولات إبراهيم الفقي عن النجاح
 التربية الروحية
 صناعة النجاح
 طريق النجاح
 كيفية إدارة المتطوعين في المنظمات غير الربحية
 التنمية الإيمانية
- التعليقات ومناقشات المبدعون (0) :